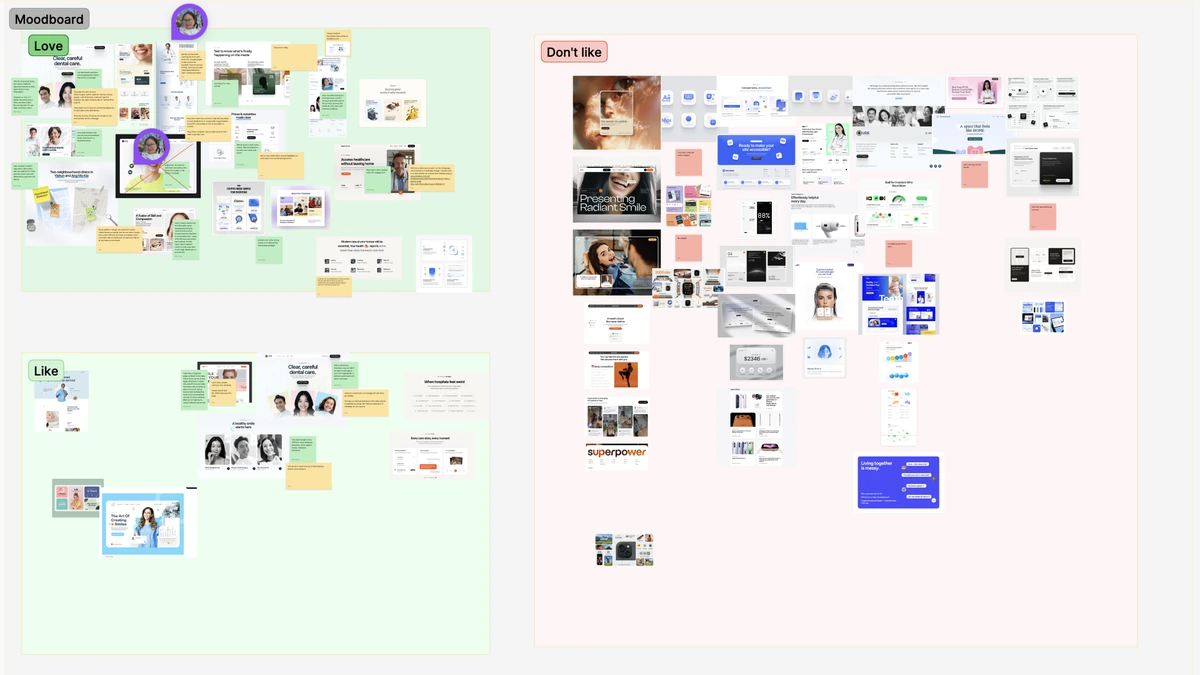
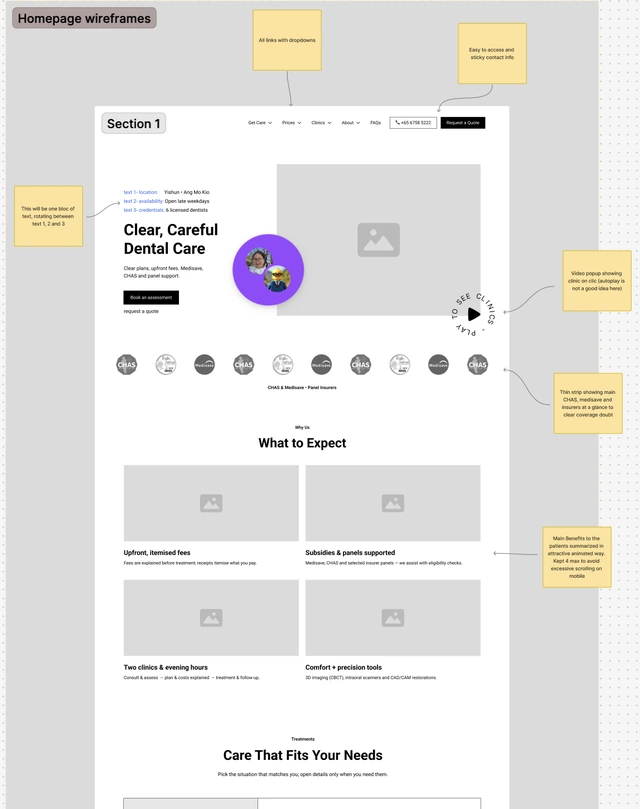
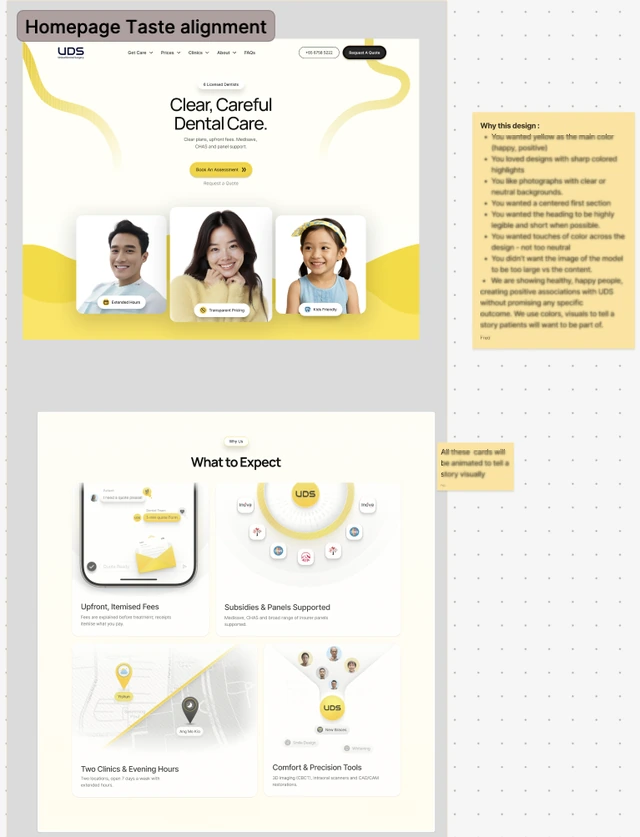
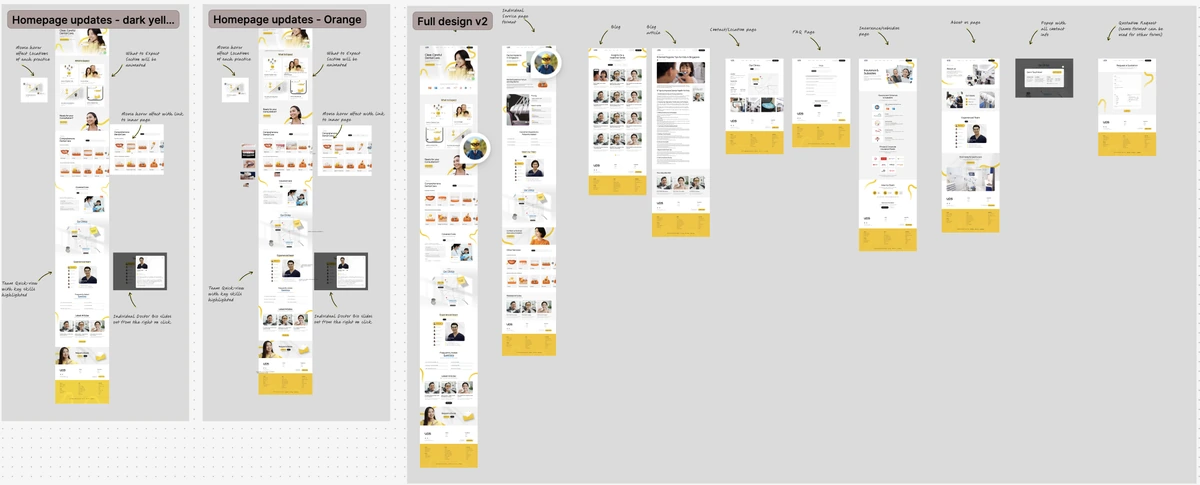
These figures show continued performance gains on the new website across two matched 84-day periods. Comparable analytics data from the previous website was unavailable. Source: Google Analytics comparison, 20 April to 12 July and 13 July to 4 October 2026.
Contact actions include configured phone, form, WhatsApp and email events. They are not verified appointments or unique patients. The rounded 3.2× ratio compares contact actions per dollar of ad spend, not total enquiry volume.
2.3× refers to the relative change in the share of paid sessions containing a phone click. Organic contact actions increased; organic phone clicks alone did not.
Copy, treatment pages and code continued to improve after launch. Tracking also improved, and other marketing activity continued during the comparison, so these figures do not isolate the redesign’s impact.
Contact actions per ad $ 3.2×
Indexed to the initial period = 100.
Cost per ad click −32%
Indexed to the initial period = 100.